Tenant-Aware Distributed Tracing: Instrumenting OpenTelemetry in Multi-Tenant Systems
A technical guide to propagating tenant context with W3C Baggage across microservices and preventing Prometheus high-cardinality metric explosions.
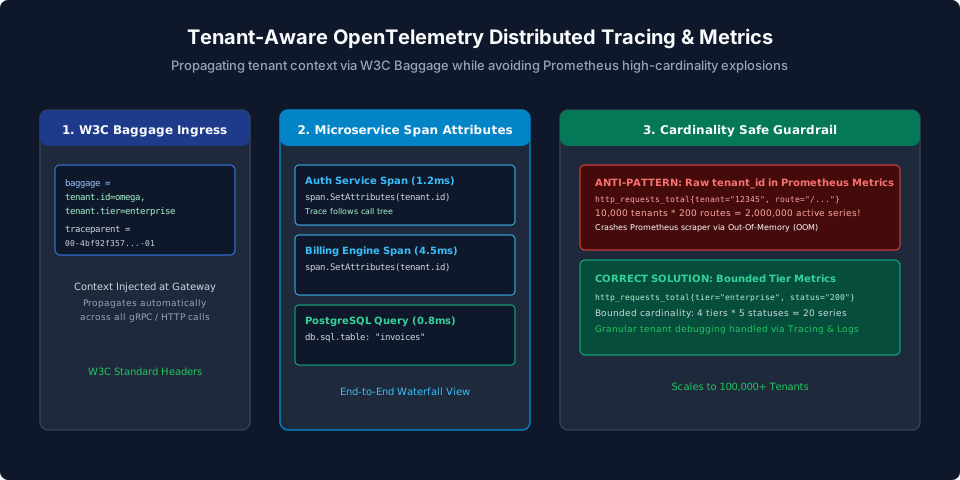
In a monolithic single-tenant application, diagnosing a performance issue is straightforward: you inspect the server logs, examine slow query telemetry, and locate the bottleneck.
In a distributed multi-tenant cloud systems architecture, troubleshooting becomes exponentially harder. When an enterprise account reports: "Our dashboard took 12 seconds to load at 09:30 this morning," an SRE looking at aggregate system metrics (e.g. "Our average API latency was 65ms at 09:30") is completely blind.
To answer customer-specific performance inquiries, your observability architecture must be tenant-aware: every distributed trace, database span, worker queue task, and log entry must carry the customer's tenant_id.
However, instrumenting multi-tenancy in observability pipelines comes with a lethal trap: Prometheus Cardinality Explosion. If you carelessly attach tenant_id as a label to Prometheus metrics, your monitoring cluster will exhaust RAM and crash.
This guide provides the complete blueprint for architecting tenant-aware observability using OpenTelemetry W3C Baggage, bounded metric dimensions, and tail-based trace sampling.
The Cardinality Trap: Metrics vs. Traces vs. Logs
The three pillars of observability handle multi-tenant dimensions completely differently:
| Observability Pillar | Technology | Can Include Raw tenant_id? |
Reason & Architectural Rule |
|---|---|---|---|
| Metrics | Prometheus, VictoriaMetrics | NO (STRICT PROHIBITION) | Cardinality Explosion: 10,000 tenants * 100 endpoints = 1,000,000 active time-series in RAM. Memory crashes. |
| Distributed Traces | OpenTelemetry, Jaeger, Tempo | YES (RECOMMENDED) | Traces are structured documents indexed by key-value tags. Query engines handle billions of unique tags easily. |
| Structured Logs | OpenSearch, Loki, ClickHouse | YES (MANDATORY) | Columnar and inverted text search handles arbitrary string cardinality without memory scaling penalties. |
The Golden Rule of cloud metrics
In Prometheus, bound all metrics to coarse, low-cardinality attributes:
# SAFE (4 Tiers = 4 Series):
http_requests_total{tier="enterprise", method="GET", status="200"}

# DISASTROUS (10,000 Tenants = 10,000 Series per endpoint):
http_requests_total{tenant_id="c1209b55...", method="GET", status="200"}
Use metrics to detect that Enterprise tier latencies are spiking; then jump to Distributed Traces to isolate which specific enterprise tenant is causing the spike.
Propagating Tenant Context via W3C Baggage
In a microservice mesh, how does an API Gateway pass the tenant_id down through the Auth Service, Billing Engine, and Database Workers without manually modifying hundreds of function signatures?
The standard solution is W3C Baggage (baggage HTTP header). Baggage is an OpenTelemetry standard for propagating key-value pairs across distributed service boundaries.
[ Client Request ]
        |
        v
[ Edge API Gateway ]
Extracts authenticated tenant_id = "omega"
Injects W3C Baggage into Request Context
        |
        +--- HTTP Request (Header: baggage: tenant.id=omega) --->
        v
[ Internal Billing Microservice ]
OpenTelemetry middleware auto-extracts baggage
Span automatically tagged with tenant.id = "omega"
        |
        +--- gRPC Request (Metadata: baggage: tenant.id=omega) --->
        v
[ Database Storage Worker ]
Worker auto-extracts baggage
Logs and DB spans automatically carry tenant.id = "omega"
Implementation: Instrumenting OpenTelemetry Baggage
Here is the production middleware to inject and extract tenant baggage:
package telemetry

import (
	"context"
	"net/http"

	"go.opentelemetry.io/otel"
	"go.opentelemetry.io/otel/attribute"
	"go.opentelemetry.io/otel/baggage"
	"go.opentelemetry.io/otel/trace"
)

const TenantIDKey = "tenant.id"
const TenantTierKey = "tenant.tier"

// IngressMiddleware extracts tenant info and injects W3C Baggage
func IngressMiddleware(next http.Handler) http.Handler {
	return http.HandlerFunc(func(w http.ResponseWriter, r *http.Request) {
		tenant := GetAuthenticatedTenant(r.Context())
		if tenant == nil {
			next.ServeHTTP(w, r)
			return
		}

		// 1. Construct W3C Baggage members
		mTenant, _ := baggage.NewMember(TenantIDKey, tenant.ID)
		mTier, _ := baggage.NewMember(TenantTierKey, tenant.Tier)
		b, err := baggage.New(mTenant, mTier)
		if err == nil {
			// Attach baggage to request context
			r = r.WithContext(baggage.ContextWithBaggage(r.Context(), b))
		}

		// 2. Set span attributes on the active trace span
		span := trace.SpanFromContext(r.Context())
		if span.IsRecording() {
			span.SetAttributes(
				attribute.String(TenantIDKey, tenant.ID),
				attribute.String(TenantTierKey, tenant.Tier),
			)
		}

		next.ServeHTTP(w, r)
	})
}

// HTTPClientTransport automatically injects baggage into outbound HTTP calls
func NewPropagatingRoundTripper(base http.RoundTripper) http.RoundTripper {
	return roundTripperFunc(func(req *http.Request) (*http.Response, error) {
		// Injects traceparent and baggage headers into outbound request
		otel.GetTextMapPropagator().Inject(req.Context(), otel.GetTextMapPropagator())
		return base.RoundTrip(req)
	})
}
Now, every downstream service that calls trace.SpanFromContext(ctx) automatically inherits tenant.id, without requiring manual context plumbing.
Tail-Based Sampling: Prioritizing Enterprise Traces
Capturing 100% of distributed traces across billions of requests is cost-prohibitive. Most software companies sample 1% to 5% of traces.
However, if an Enterprise paying $200,000/year experiences an outage, telling them "we only sampled 1% of your traces so we have no data" is unacceptable.
The solution is Tail-Based Sampling configured in your OpenTelemetry Collector:
# otel-collector-config.yaml
processors:
  tail_sampling:
    decision_wait: 10s
    num_traces: 10000
    expected_new_traces_per_sec: 2000
    policies:
      # Rule 1: Always keep 100% of traces with errors (HTTP 500)
      - name: drop-errors-policy
        type: status_code
        status_code: { status_codes: [ ERROR ] }

      # Rule 2: Always keep 100% of Enterprise customer traces
      - name: enterprise-tenant-policy
        type: string_attribute
        string_attribute:
          key: tenant.tier
          values: [ "enterprise" ]
          enabled_regex_matching: false

      # Rule 3: Always keep slow traces (> 1.5 seconds)
      - name: latency-policy
        type: latency
        latency: { threshold_ms: 1500 }

      # Rule 4: Sample 2% of standard/free tier traces
      - name: probabilistic-standard-tier
        type: probabilistic
        probabilistic: { sampling_percentage: 2.0 }
Asynchronous Context Propagation via Message Brokers (Kafka / SQS)
When requests trigger background work, HTTP context propagation is severed unless trace metadata is explicitly attached to broker message headers.
For Apache Kafka or AWS SQS, serialize W3C traceparent and baggage into message headers using the OpenTelemetry TextMapPropagator:
// Producer: Injects trace context into Kafka message headers
func PublishTenantEvent(ctx context.Context, producer sarama.SyncProducer, topic string, payload []byte) error {
	msg := &sarama.ProducerMessage{
		Topic: topic,
		Value: sarama.ByteEncoder(payload),
	}

	carrier := propagation.MapCarrier{}
	otel.GetTextMapPropagator().Inject(ctx, carrier)

	for k, v := range carrier {
		msg.Headers = append(msg.Headers, sarama.RecordHeader{
			Key:   []byte(k),
			Value: []byte(v),
		})
	}

	_, _, err := producer.SendMessage(msg)
	return err
}

// Consumer: Extracts trace context in background worker
func ConsumeTenantEvent(handler func(context.Context, []byte) error, msg *sarama.ConsumerMessage) error {
	carrier := propagation.MapCarrier{}
	for _, h := range msg.Headers {
		carrier[string(h.Key)] = string(h.Value)
	}

	ctx := otel.GetTextMapPropagator().Extract(context.Background(), carrier)
	tr := otel.Tracer("worker-service")
	ctx, span := tr.Start(ctx, "process_tenant_event")
	defer span.End()

	return handler(ctx, msg.Value)
}
Attribute Redaction and PII Filtering in the Collector
In multi-tenant architectures, engineers might inadvertently append customer-identifiable information (such as credit card numbers or user emails) to span attributes. Deploy the OpenTelemetry transform processor to strip or hash sensitive data before traces leave your network perimeter:
processors:
  transform:
    trace_statements:
      - context: span
        statements:
          # Redact user emails from attributes
          - replace_pattern(attributes["user.email"], ".*@.*", "[REDACTED_EMAIL]")
          # Ensure tenant.tier is lowercase for consistent aggregation
          - set(attributes["tenant.tier"], ToLower(attributes["tenant.tier"]))
Summary Checklist for Production
- No Tenant IDs in Prometheus: Ban raw
tenant_idlabels in metric counters and histograms. - Use Coarse Tiers in Metrics: Restrict metric labels to
tier: starter | pro | enterprise. - Propagate W3C Baggage: Inject
tenant.idinto baggage at API gateways and propagate across downstream RPCs. - Inject Context in Message Brokers: Transmit
traceparentandbaggageacross Kafka and SQS message headers. - Redact PII in Collector Pipelines: Mask customer emails and secrets using the OpenTelemetry transform processor.
- Tag Spans and Logs: Ensure all database spans and structured loggers extract
tenant.idfrom context. - Deploy Tail-Based Sampling: Keep 100% of Enterprise customer and error traces while sampling standard traffic.
Frequently Asked Questions
What is the difference between OpenTelemetry Trace Attributes and Baggage?
Trace Attributes are scoped strictly to the single span where they are set and do not propagate downstream. Baggage values are serialized into W3C HTTP headers and automatically propagate across all subsequent downstream microservice and RPC calls.
What happens if you put 10,000 tenant IDs as labels in Prometheus?
Prometheus creates a distinct time-series memory structure for every unique combination of label values. Multiplying 10,000 tenants by 200 HTTP endpoints results in 2,000,000 active series, causing Prometheus to exhaust RAM and crash during scraping.
How do you filter slow database queries for a specific tenant in Grafana Tempo or Jaeger?
Because OpenTelemetry spans capture `tenant.id` as a span attribute, you run a trace search: `span.tenant.id = 'acme' && duration > 500ms`, which instantly isolates the slow queries without overloading Prometheus metrics.
How do you propagate tenant context across asynchronous message queues like Kafka?
Use the OpenTelemetry TextMapPropagator to inject the W3C traceparent and baggage into the Kafka Record Headers when producing, and extract them into the consumer context before executing job handlers.
What is Tail-Based Sampling in OpenTelemetry?
Tail-based sampling evaluates the entire distributed trace after it completes. If the trace contains an error (HTTP 500), involves an Enterprise tenant, or took longer than 1.5 seconds, the OpenTelemetry Collector keeps 100% of the trace.
How can tenant-aware tracing help debug noisy neighbor issues?
By searching traces with high queue wait times grouped by tenant, you can immediately identify which specific customer's batch queries are occupying connection pools or worker threads.